Weekend price outlook for ETH, ADA, MIOTA

ETH, MIOTA and ADA are trading positive but face pressure near crucial price levels
Bitcoin has retreated off the $40k price level again, while the altcoin market has shown a mixed response heading into the weekend.
Overall, the market remains bullish and fresh moves could see many coins push above key resistance zones. Here’s the price outlook for ETH, MIOTA, and ADA.
IOTA price outlook
IOTA’s price is up 29% this week after bulls rallied to record a ‘V’ shaped bounce that has seen the price test the crucial resistance zone at $0.90. The MIOTA/USD pair currently trades at $0.84, a percentage point higher in the past 24 hours.
MIOTA/USD daily chart. Source:TradingView
If MIOTA/USD continues to track the ascending trendline, bulls might target the 38.2% Fib level and then $1.00(just above the 50% Fib level currently at $0.99). The RSI is near 56, indicating buyers are in a strong position and the MACD is also bullish with the signal above the neutral zone. This gives IOTA an overall bullish outlook heading into the weekend.
The 50 SMA ($0.83) and the 23.6% Fib level ($0.77) offer primary support levels if bears overpower bulls in coming sessions. A negative trajectory could then see prices fall to main support at $0.57.
Ethereum price outlook
Ethereum price is trading around $2,408 at time of writing, outpacing Bitcoin on the day with 4% gains but lagging the benchmark cryptocurrency’s 23% upside this week.
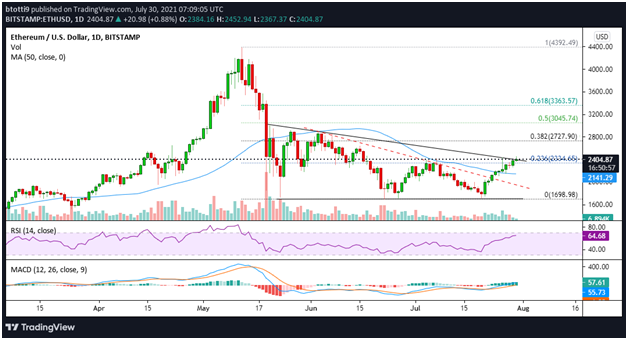
ETH/USD is following a bullish trendline on the daily chart, currently above the 50 SMA and the 23.6% Fibonacci retracement level of the decline from $4,380 to $1,700.
The chart shows the daily RSI is above 64 and the MACD is increasing after a bullish crossover to suggest bulls are in control.


ETH/USD daily chart. Source:TradingView
A daily close above $2,410 – the monthly resistance – could lead to fresh bids towards the 38.2% Fib level ($2,727) and possibly the 50% Fib level ($3,046).
On the downside, support lies at $2,334 and $2,141, with a negative flip likely to see bulls defend gains near $2,100 over the weekend.
Cardano price outlook
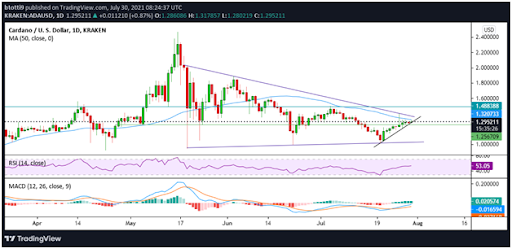
ADA is up 2% and about 10% in the past 24 hours and seven days respectively. It currently trades along an ascending trendline with resistance at the 50 SMA ($1.32). Notably, bulls have struggled to breach the supply wall for the last three days.


ADA/USD daily chart. Source:TradingView
However, technical indicators favour bulls. The daily RSI is above the equilibrium mark, while the daily MACD is rising after a bullish crossover. If ADA/USD breaks above $1.32, increased buy pressure could trigger a fresh rally towards horizontal resistance at $1.48 and potentially $1.60.
On the downside, rejection below $1.28 could trigger more losses towards support at $1.25 and $1.14.


