BTC/USD Ready for a Cross Above $24,000

Join Our Telegram channel to stay up to date on breaking news coverage
Following the $23,900 break, the Bitcoin price prediction shows BTC dropping slightly after getting rejected at $24,170.
Bitcoin Prediction Statistics Data:
Bitcoin price now – $23,963
Bitcoin market cap – $456.8 billion
Bitcoin circulating supply – 19.2 million
Bitcoin total supply – 19.2 million
Bitcoin Coinmarketcap ranking – #1
BTC/USD Long-term Trend: Bullish (Daily Chart)
Key levels:
Resistance Levels: $27,000, $28,000, $29,000
Support Levels: $21,000, $20,000, $19,000
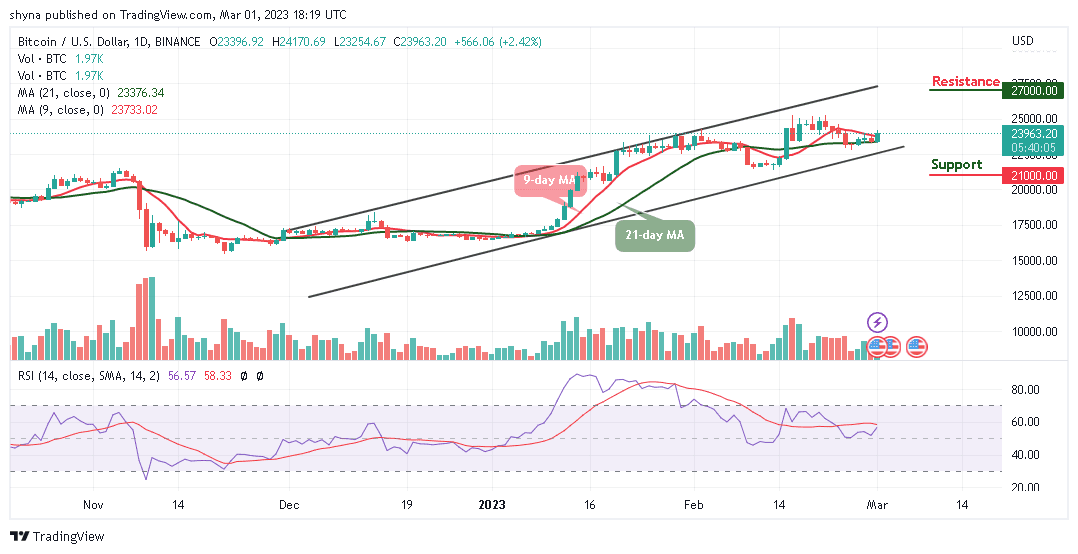
BTC/USD is now retreating after touching the daily high of $24,170 today. The Bitcoin price is yet to make any ground toward the upper boundary of the channel. Meanwhile, the king coin is trading with a gain of 2.42% as it moves to cross above the 9-day and 21-day moving averages.
Bitcoin Price Prediction: Bitcoin Price May Consolidate Around $39k
The daily chart reveals that the Bitcoin price may begin to develop some bullish signals if the king coin remains above the 9-day and 21-day moving averages. However, the resistance provided during the European session reveals that the first digital asset could maintain the bullish movement. Meanwhile, the market price remains bullish as the signal line of the Relative Strength Index (14) moves to cross above the 60-level.
In the meantime, the Bitcoin price needs to break the $24,000 resistance to make the market bullish. But, if the sellers bring the market price beneath the support at $23,500, the next level of support could lie at $22,500. Wherefore, beneath this, additional supports could be found at $21,000, $20,000, and $19,000 respectively. Meanwhile, should in case the bulls push higher, the Bitcoin price may hit the potential resistance levels at $27,000, $28,000, and $29,000.
BTC/USD Medium-term Trend: Ranging (4H Chart)
Looking at the 4-hour chart, BTC/USD is ranging within the channel. During the European session today, Bitcoin (BTC) touches the high of $24,008 before retreating to where it is currently changing hands at $23,917. Further bearish movement could locate the support level at $23,000 and below.
However, the technical indicator Relative Strength Index (14) is below the 60-level as the Bitcoin price remains above the 9-day and the 21-day moving averages. Any further bullish movements could push the market price to the potential resistance level of $25,000 and above.
Bitcoin Alternatives
The Bitcoin price is likely to rise more if the bulls could defend the $23,500 level; the king coin may continue its upward movement by breaking toward the upper boundary of the channel after keeping the price above the 9-day and 21-day moving averages. However, FightOut is another token that will roll out up to 20 gyms initially, starting in the cities that have the most vibrant FightOut communities, with the platform eventually having a hub in all the world’s pre-eminent global cities as the presale is still ongoing and almost $5.5 million has been raised so far.
Fight Out (FGHT) – Move to Earn in the Metaverse
CertiK audited & CoinSniper KYC Verified
Early Stage Presale Live Now
Earn Free Crypto & Meet Fitness Goals
LBank Labs Project
Partnered with Transak, Block Media
Staking Rewards & Bonuses
Join Our Telegram channel to stay up to date on breaking news coverage


