BTC/USD Trades Above $17k Level

Join Our Telegram channel to stay up to date on breaking news coverage
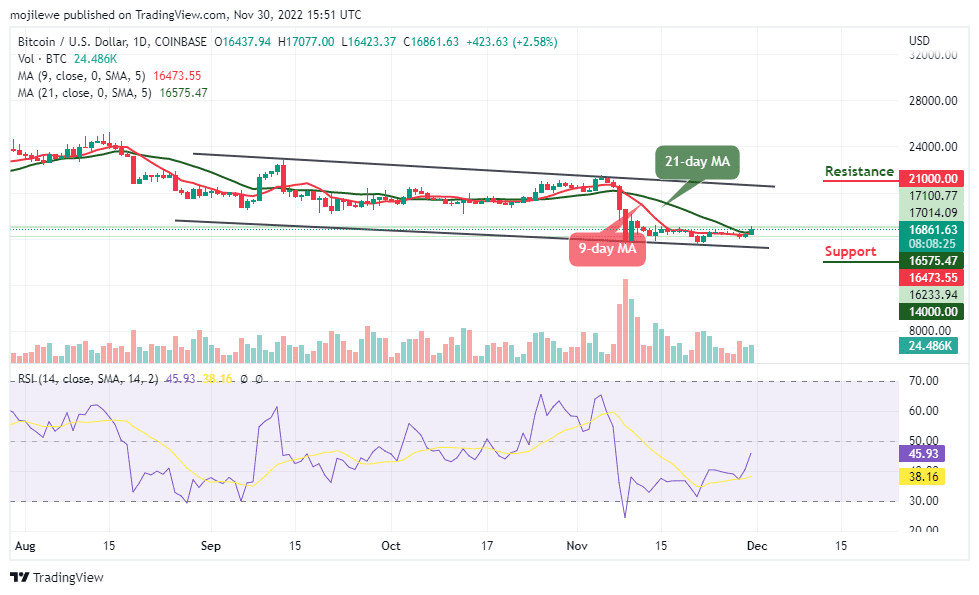
The Bitcoin price prediction shows that BTC touches the daily high of $17,077, and the coin is holding above the $16,500 level.
Bitcoin Prediction Statistics Data:
Bitcoin price now – $16,861
Bitcoin market cap – $324.49 billion
Bitcoin circulating supply – 19.2 million
Bitcoin total supply – 19.2 million
Bitcoin Coinmarketcap ranking – #1
BTC/USD Long-term Trend: Ranging (Daily Chart)
Key levels:
Resistance Levels: $21,000, $23,000, $25,000
Support Levels: $14,000, $12, 000, $10,000
BTC/USD has been extremely volatile as the coin has traded above the resistance level of $17,000 in the past few weeks. At the moment, the Bitcoin price seems to be stuck around the 9-day and 21-day moving averages. More so, BTC/USD is ranging within the channel. Therefore, since the price is above the 9-day and 21-day moving averages, it indicates that a breakout may come to play.
Bitcoin Price Prediction: Bitcoin (BTC) May Reclaim $20,000 Resistance
According to the daily chart, if the Bitcoin price stays above the moving averages, traders can expect a rise toward the upper boundary of the channel. However, it is important to note that the red line of the 9-day MA must cross above the green line of the 21-day MA to confirm the arrival of the bullish trend.
On other hand, if the market price drives below the moving averages, the BTC price may likely see support levels at $14,000, $12,000, and $10,000, bringing the price to a new low. Meanwhile, strong buying pressure may take the price to the resistance level of $18,000. While trading at that level, a bullish continuation could hit the potential resistance levels of $21,000, $23,000, and $25,000 as the Relative Strength Index (14) moves to cross above the 50-level.
BTC/USD Medium-term Trend: Ranging (4H Chart)
Looking at the 4-hour chart, BTC/USD remains trading above the 9-day and 21-day moving averages. Nevertheless, Bitcoin has not yet slipped below this barrier as it is still in the loop of making a bounce back. Therefore, the BTC price hovers around $16,866 and may take time to cross above the upper boundary of the channel. The upward movement could face a resistance level of $17,800 and above.
On the downside, immediate support is below the 9-day moving average while the main support is at the $16,500 level. The price might slide sharply below $16,300 to test the main support at the $16,200 level. Moreover, BTC/USD is likely to face more losses in the near term if the Relative Strength Index (14) nosedives below the 60-level, indicating a bearish movement.
Meanwhile, the Impact Token (IMPT) makes it easier for everyone to contribute to a greener and more sustainable environment. Now is a fantastic opportunity to invest in the project. The IMPT presale is ongoing, and roughly 13.5 million has been raised so far.
Nevertheless, D2T token presale is live and it has realized close to $8 million. Dash 2 Trade (D2T) is a unified analytics platform for market-beating intelligence and features to take your trading experience to the next level. Additional team members have been onboarded, and its presale dashboard beta launch is coming soon.
Related
Dash 2 Trade – High Potential Presale
Active Presale Live Now – dash2trade.com
Native Token of Crypto Signals Ecosystem
KYC Verified & Audited
Join Our Telegram channel to stay up to date on breaking news coverage


